Venn diagram is the most popular diagram in scientific research articles and can be utilized to describe the relationship between various data sets. From the Venn diagram, you can simply identify the commonalities and variations between those datasets. In this article, we have discussed How to Design Professional Venn Diagrams in Python by using 2 groups and three groups. We have also discussed different ways to generate Venn diagrams in Python and how to modify these diagrams. You will also see the best Tips to Design Professional Venn Diagrams in Python.
What is Python?
Table of Contents
Python is an object-oriented, high-level, and interpreted programming language. It has built-in data structures, connected with dynamic typing and dynamic binding, making it a great choice for Rapid Application Development. Python also gives support for modules and packages, which provides reuse of code and system modularity.
It is one of the fastest programming languages that one can learn. The reason which makes it easy to learn because it requires very few lines of code. It’s a great choice for beginners because of its simplicity and readability. Python supports modules and packages, which supports the reuse of program code and modularity.
What Is a Venn Diagram?
A Venn diagram also termed as a set diagram, primary diagram, or logic diagram is a diagram that presents all reasonable, logical relations between a limited number of various sets. A circle describes each set. The circle size describes the quality of the group.
The collections are normally overlapping: the size of the overlap describes the junction between both collections. It is unadvised to create a Venn diagram with more than 3 collections because it would become difficult to read. In python, the Venn diagram is obtained utilizing the venn2 and venn3 function of the matplotlib library according to the number of collections you have. See here for module installation.
When to use Venn diagram
Venn diagrams are utilized to analyze and compare groups of things.
They are a valuable tool for developmental assessment because they:
- can be utilized to make discussion; and
- provide instructors with data about students’ thinking.
How to Design Professional Venn Diagrams in Python
Firstly, you have to install the library to your computer. Practice the following command in your terminal.
pip install matplotlib-venn
After installing, you can start coding. You are going to introduce the following libraries.
#Import libraries
from matplotlib_venn import venn2, venn2_circles, venn2_unweighted
also, from matplotlib_venn import venn3, venn3_circles
from matplotlib import pyplot as plt
%matplotlib inline
Venn Diagram with 2 Groups
To create a Venn Diagram for two groups, use venn2.
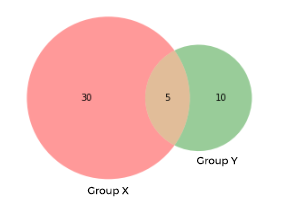
venn2(subsets = (30, 10, 5), set_labels = (‘Group X’, ‘Group Y’))
The subsets parameter is a 3 element list where the numbers 30, 10, 5 correspond to Ab, aB, AB.
- Xy= Included in assembly X, but not Y
- xY = Included in assembly X, but not Y
- XY = Included in both assembly X and Y
The set_labels parameter enables you to identify your two assemblies in the Venn diagram.
Modifying the Venn Diagram
The default circle colors are green and red, but the good thing is that you can change the colors! Add the set_colors parameter to change the colors of your assemblies. Besides, you can utilize the alpha parameter to check the transparency.

venn2(subsets = (30, 10, 5), set_labels = (‘Group X’, ‘Group Y’), set_colors=(‘purple’, ‘skyblue’), alpha = 0.7);
The best thing about the Venn diagram is that it automatically changes the circle size by the measurement of the different items inside the circle. However, if you do not want the circles to be weighted, instead, you can utilize the unweighted Venn diagram.

The two assemblies are now the identical dimension, even though group X is bigger than group Y.
venn2_unweighted(subsets = (30, 10, 5), set_labels = (‘Group X’, ‘Group Y’), set_colors=(‘r’, ‘g’), alpha = 0.5);
You can further modify your Venn diagram by covering an outline of the circle above the primary. Keep in mind this works just with the weighted Venn diagrams.

venn2(subsets = (30, 10, 5), set_labels = (‘Group X’, ‘Group Y’),
set_colors=(‘r’, ‘g’), alpha = 0.5);
venn2_circles(subsets = (30, 10, 5));
If you don’t want to favor the solid line, you can modify it to another line style with the lifestyle parameter. You can fix the line diameter as well.

venn2(subsets = (30, 10, 5), set_labels = (‘Group X’, ‘Group Y’), set_colors=(‘r’, ‘g’), alpha = 0.5);venn2_circles(subsets = (30, 10, 5), linestyle=’dashed’, linewidth=2, color=’k’);
Let’s give the diagram a name!
plt.title(“I created a Venn Diagram!”);
How to Design Professional Venn Diagrams in Python with 3 Groups
To generate Venn diagrams with 3 assemblies in place of 2, we change from venn2 to venn3.
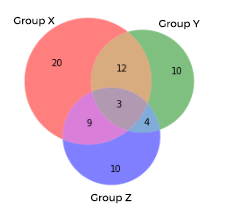
venn3(subsets = (20, 10, 12, 10, 9, 4, 3), set_labels = (‘Group X’, ‘Group Y’, ‘Group Z’), alpha = 0.5);
You can modify each area’s colors of the diagram with the get_patch_by_id method. Keep in mind that the middle area where all 3 circles overlap is now orange.
v.get_patch_by_id(‘111’).set_color(‘orange’)
Check the below-given diagram

The last thing we want to explain is how you can change the line’s width for each circle. If we set the Venn diagram circle to the variable c, we can call all circles c[0], c[1], or c[2] and set the line width.
c = venn3_circles(subsets = (20, 10, 12, 10, 9, 4, 3), linestyle=’dashed’, linewidth=1, color=”grey”)c[0].set_lw(5.0)
c[1].set_lw(8.0)
c[2].set_lw(2.0)
Conclusion- how to design professional Venn diagrams in Python
Above we have discussed all the essential pieces of information that are helpful for you and you will also know How to Design Professional Venn Diagrams in Python. We have included information regarding how one can create a Venn diagram with different kinds of groups.
Besides this, we have also discussed the Tips to Design Professional Venn Diagrams in Python. Try to use all the tips to design the Venn diagram to illustrate the python code’s functioning.
If you are facing any difficulty related to any assignment, you can contact our experts who are well-versed with the difficulty of programming. Using these experiences, our Python programming help professionals can solve those issues in the best possible way. We are also accessible 24*7 with instant programming assignment help to contact us whenever you have any difficulty with the syntax of Python programming.